-
 info@xpert-bookkeeping.com
-
 Inquire about Tax Services:
(254) 277-0005
Inquire about Tax Services:
(254) 277-0005
info@xpert-bookkeeping.com
Inquire about Tax Services:
(254) 277-0005
 September 23, 2026
 9 min read mins read
  0 Comments
 Most restaurant owners have seen a profit-and-loss statement. Fewer know how to read one in a way that helps them run the business. When built correctly for a food-service operation, a P&L can show where margins are holding and where they are slipping. Which costs are reducing profit? For questions about the timing of money coming in and going out, review cash flow alongside the P&L. A restaurant P&L can also help you estimate how much you need to sell to break even.
Restaurant bookkeeping and financial reporting require accurate records and consistent definitions. This guide explains the restaurant P&L in plain language, starting with prime cost.
A profit and loss statement, also called a P&L or income statement, summarizes a restaurant’s revenue and expenses over a defined period and shows whether the business made a profit or incurred a loss during that period. A P&L reports income and expenses; it does not, by itself, explain loan principal payments, owner draws, capital purchases, or the timing of cash receipts and payments. Review cash flow alongside the P&L when you need that information.
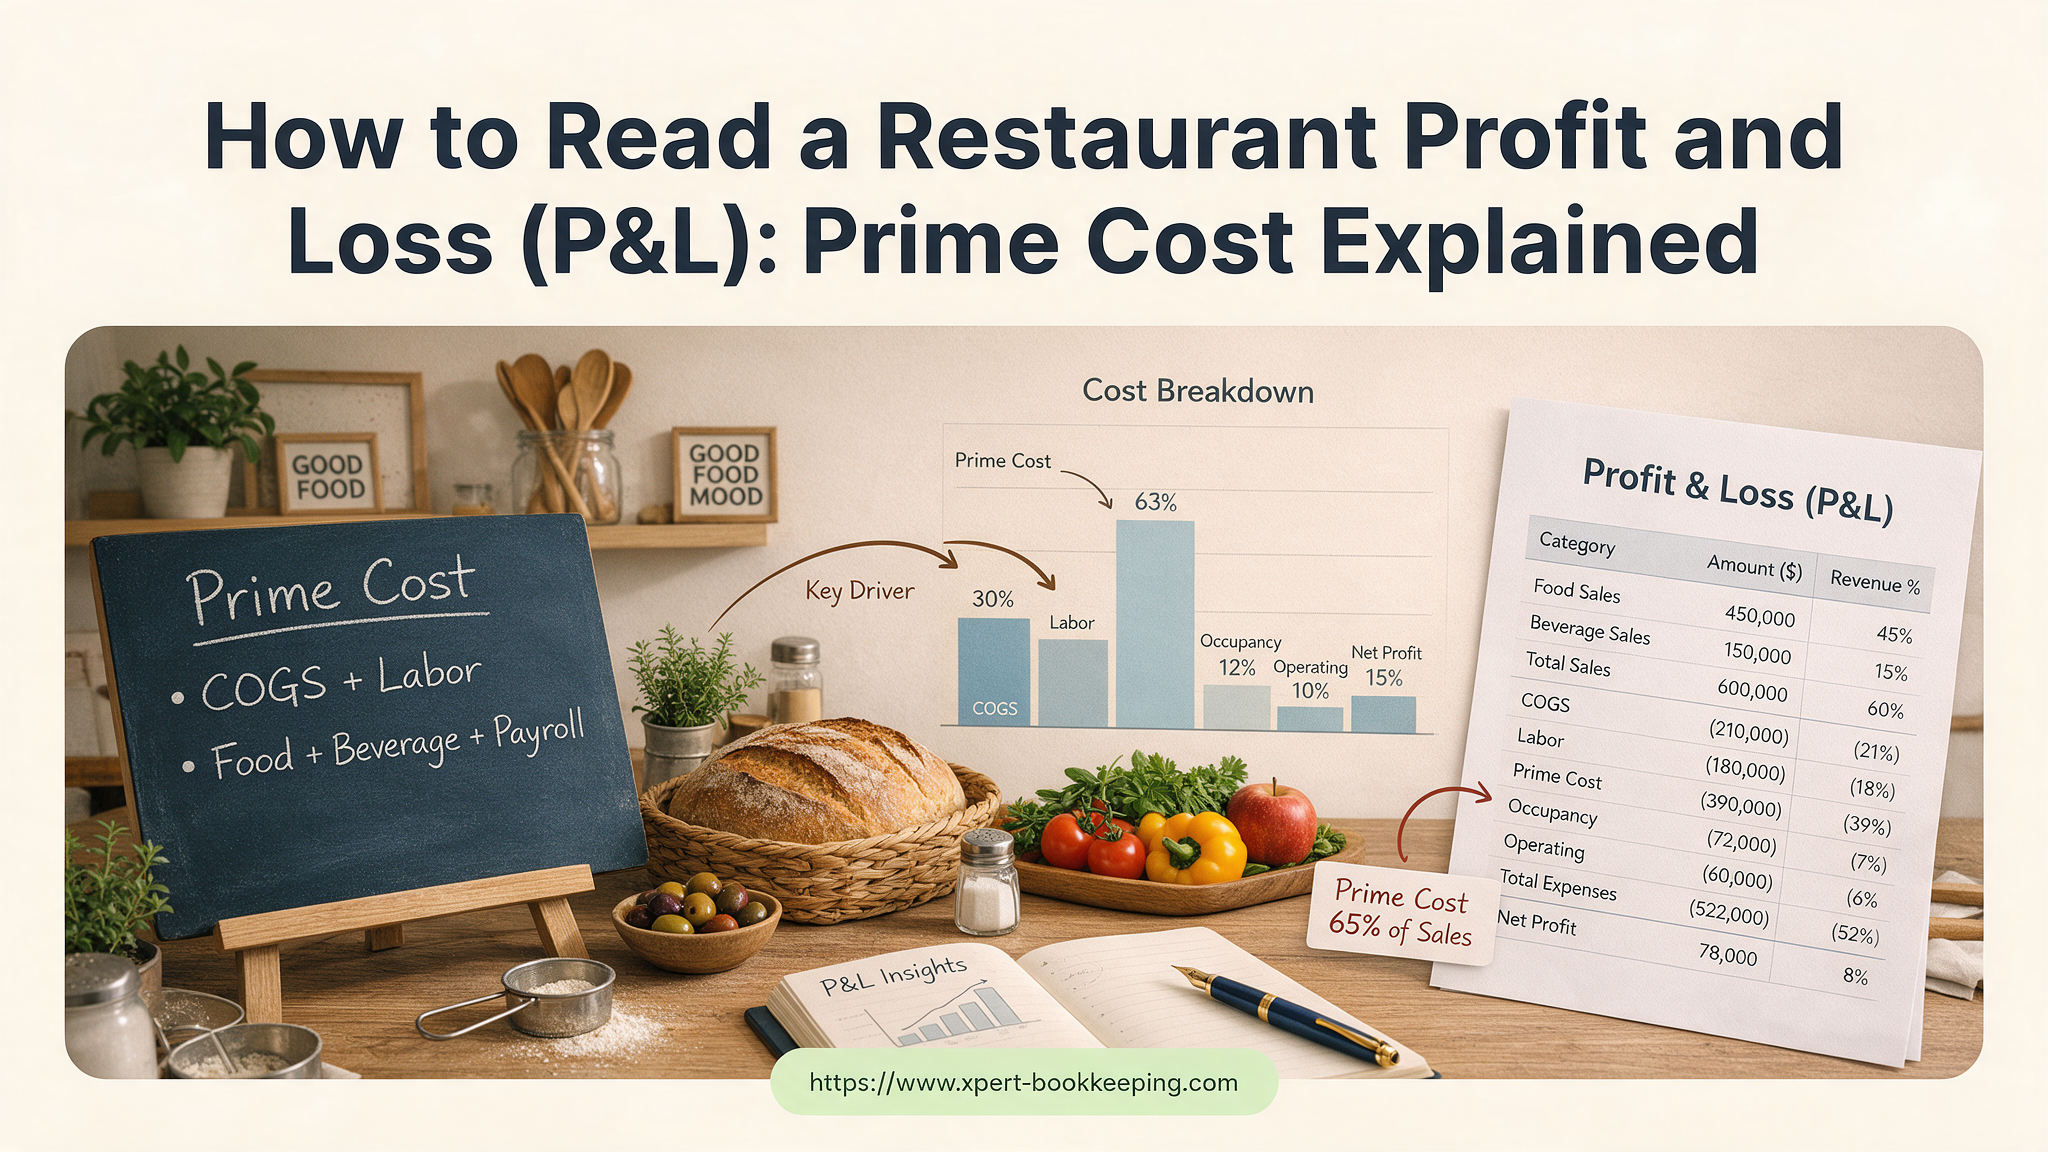
For a restaurant, the standard P&L structure looks like this:
| Line Item | What It Represents |
| Total Revenue | All food, beverage, and other sales |
| Cost of Goods Sold (COGS) | Food and beverage costs used during the reporting period, based on inventory and purchases. |
| Gross Profit | Revenue minus COGS |
| Labor Cost | Wages, salaries, payroll taxes, benefits |
| Prime Cost | COGS plus labor cost |
| Operating Expenses | Rent, utilities, supplies, marketing, etc. |
| Net Profit (or Loss) | What remains after all expenses |
The most important thing to understand is that in a restaurant P&L, the numbers on the left matter less than the percentages on the right. A food cost of $18,000 means nothing until you know whether it represents 28% or 38% of your food sales. The percentage is what tells you whether you have a problem.
Prime cost is the combined total of your cost of goods sold, meaning food and beverage costs, and your total labor cost, including wages, payroll taxes, and benefits. It is one of the most important metrics on a restaurant P&L because it captures the two largest and most controllable cost categories in food service.
The formula is simple:
Food Cost + Beverage Cost + Total Labor Cost = Prime Cost
Prime-cost targets vary by concept, service model, menu mix, pricing, labor model, and location. Rather than applying one universal benchmark, compare your restaurant’s prime cost with its own historical results and a clearly defined target. The key is to calculate food, beverage, and labor costs consistently and investigate meaningful changes over time.
Revenue
Revenue is broken into food sales, beverage sales, and any other income categories relevant to your concept. Review each category separately. If beverage sales are down as a percentage of total revenue, that’s a signal worth understanding, because beverages typically carry higher margins than food. If you’re selling more but making less, your P&L can help identify whether rising food costs, labor expenses, or operating costs are absorbing the additional revenue.
Cost of Goods Sold
COGS is the cost of food and beverages used during the reporting period. Vendor invoices and inventory records are inputs, but purchases alone do not equal usage. A common starting point for food cost is beginning inventory plus purchases minus ending inventory, adjusted for transfers, credits, and waste, when applicable.
Food cost percentage is calculated as: Food Cost Percentage = Food Cost ÷ Food Sales × 100
If food cost percentage is rising consistently or differs materially from the restaurant’s established target, investigate purchasing prices, portion control, waste, inventory counts, transfers, credits, and sales mix.
Labor Cost
Labor includes wages, salaries, overtime, payroll taxes, and employer-paid benefits. Review labor as a percentage of total revenue and compare changes with sales volume, scheduling, overtime, staffing levels, and the restaurant’s established target. Food and labor costs should be tracked separately because the corrective actions are different.
Operating Expenses
Operating expenses include rent, utilities, insurance, repairs, marketing, and supplies. Which operating costs are reducing profit? For questions about the timing of money coming in and going out, review a cash-flow report alongside the P&L.
Net Profit
Net profit is what remains after all recorded expenses are subtracted from revenue. The appropriate margin depends on the restaurant’s concept, pricing, occupancy costs, debt, owner compensation, tax treatment, and reporting definitions. Compare the result with historical performance and the restaurant’s financial plan rather than applying a universal “healthy” range.
| Review Frequency | What to Monitor |
| Daily | Sales, payment types, discounts, refunds, and unusual activity. |
| Weekly | Sales, labor, food-cost indicators, scheduling, and prime-cost trends. |
| Monthly | A full P&L, operating expenses, inventory adjustments, accruals, and broader profitability trends. |
Weekly operational monitoring can help owners identify changes in sales, labor, and food-cost indicators early. A full weekly P&L requires dependable inventory counts, accurate cost-of-goods calculations, and appropriate accrual timing. Monthly P&L reporting may provide a more reliable view when dependable inventory counts and accrual data are not available weekly.
Break-even sales are the revenue amount your restaurant needs to generate during a specified period to cover its fixed and variable costs for that same period. Knowing this number answers one of the most important questions for a restaurant owner: “How much do I need to sell this week just to cover my costs?” It accounts for your fixed costs, which don’t change with volume, and your variable cost percentages, which do.
A simplified version of the calculation: Fixed Costs ÷ (1 − Variable Cost Percentage) = Break-Even Sales
Use fixed costs and variable costs measured over the same period as the sales figure. For example, if weekly break-even sales are $28,000, compare that target with projected full-week sales rather than sales recorded only through Wednesday. The break-even period must match the period used to measure fixed costs; for example, weekly fixed costs with weekly sales or monthly fixed costs with monthly sales.
Restaurant financial reporting is most useful when the underlying records, categories, inventory timing, and sales data are consistent.
Xpert Bookkeeping supports restaurant owners in the Rio Grande Valley and Central Texas with restaurant bookkeeping, financial reporting, and related accounting support. Our team is available Monday through Friday, 8:00 am to 5:00 pm. Depending on the engagement, support may include bookkeeping, POS and payroll record coordination, financial reporting, food-cost and labor-cost reporting, QuickBooks setup or cleanup, and tax-ready records for coordination with the client’s tax professional.
Learn more about Xpert Bookkeeping’s restaurant-focused bookkeeping and financial reporting services.
Q1: What is prime cost in a restaurant P&L, and what should it be?
A. Prime cost is COGS plus total labor cost. The appropriate target varies by concept, service model, pricing, labor model, and location. Track it consistently and compare it with the restaurant’s historical performance and defined operating target.
Q2: How is a restaurant P&L different from a standard business P&L?
A. A restaurant P&L often separates food, beverage, labor, and operating costs and measures them against relevant sales categories. This can help identify where margins are changing, but the report’s usefulness depends on accurate classifications and timing.
Q3: How often should I review my restaurant’s P&L to catch problems?
A. Monitor sales, labor, food-cost indicators, and prime-cost trends weekly when reliable data is available. Review a full P&L monthly or at another dependable reporting interval based on inventory and accrual timing. Break-even analysis can also be reviewed weekly, but the sales projection and fixed-cost period must match.
Q4: Why doesn’t my POS match my bank deposits?
A. POS sales and bank deposits can differ because of timing differences, cash transactions, card processing, tips, refunds, or data that was not transferred correctly between systems. Compare POS, payroll, card-processing, and bank records to identify the source and confirm that reported revenue reflects the restaurant’s activity.